Rest Recovery Windows and Three-Point Accuracy Correlations Across NBA Back-to-Backs
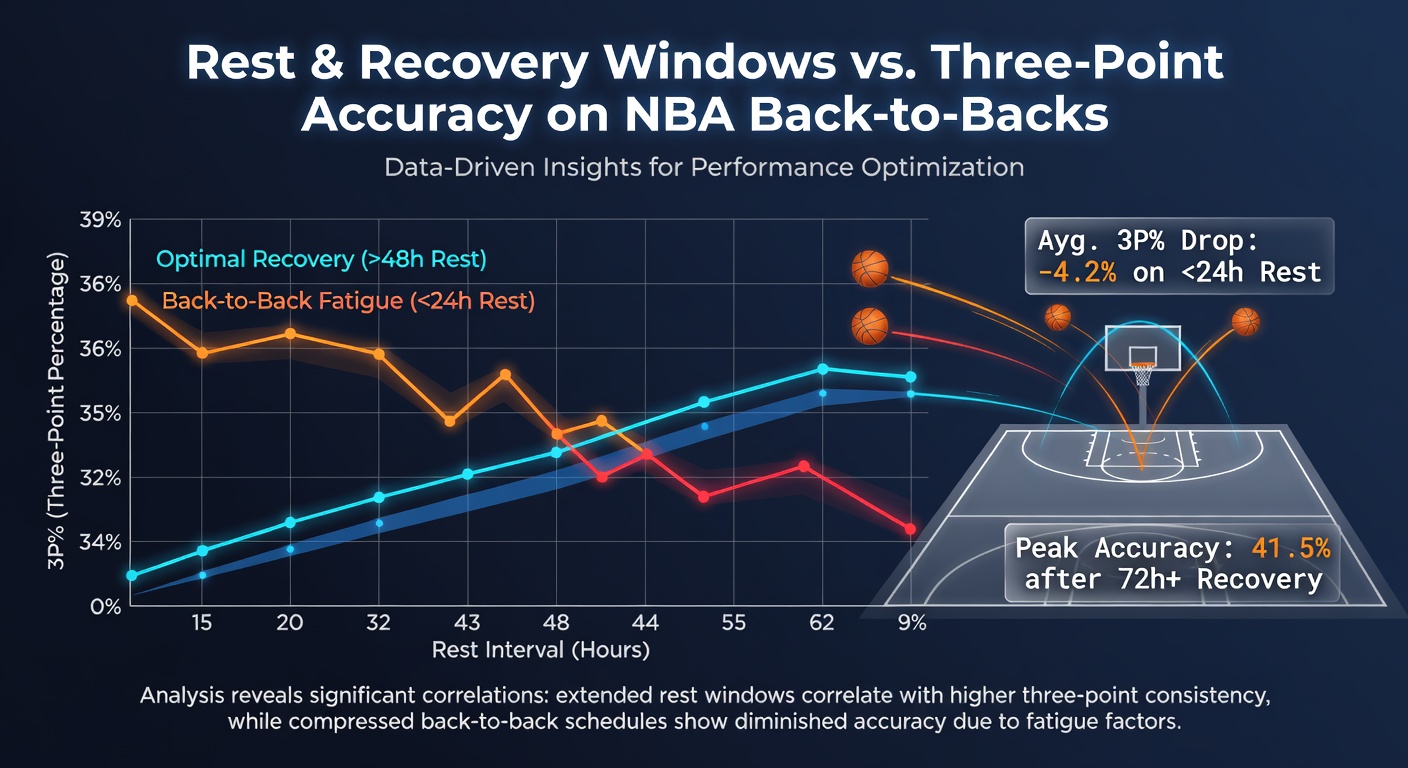
NBA schedules pack consecutive games into tight windows where teams play on back-to-back nights and recovery time shrinks dramatically, so analysts track how rest intervals connect to three-point shooting percentages across those matchups. Data from recent seasons shows that teams with less than 24 hours between games often see three-point accuracy dip by several points compared to squads that enjoy longer recovery periods, yet the patterns vary by player role and travel distance as well.
Understanding Back-to-Back Scheduling Patterns
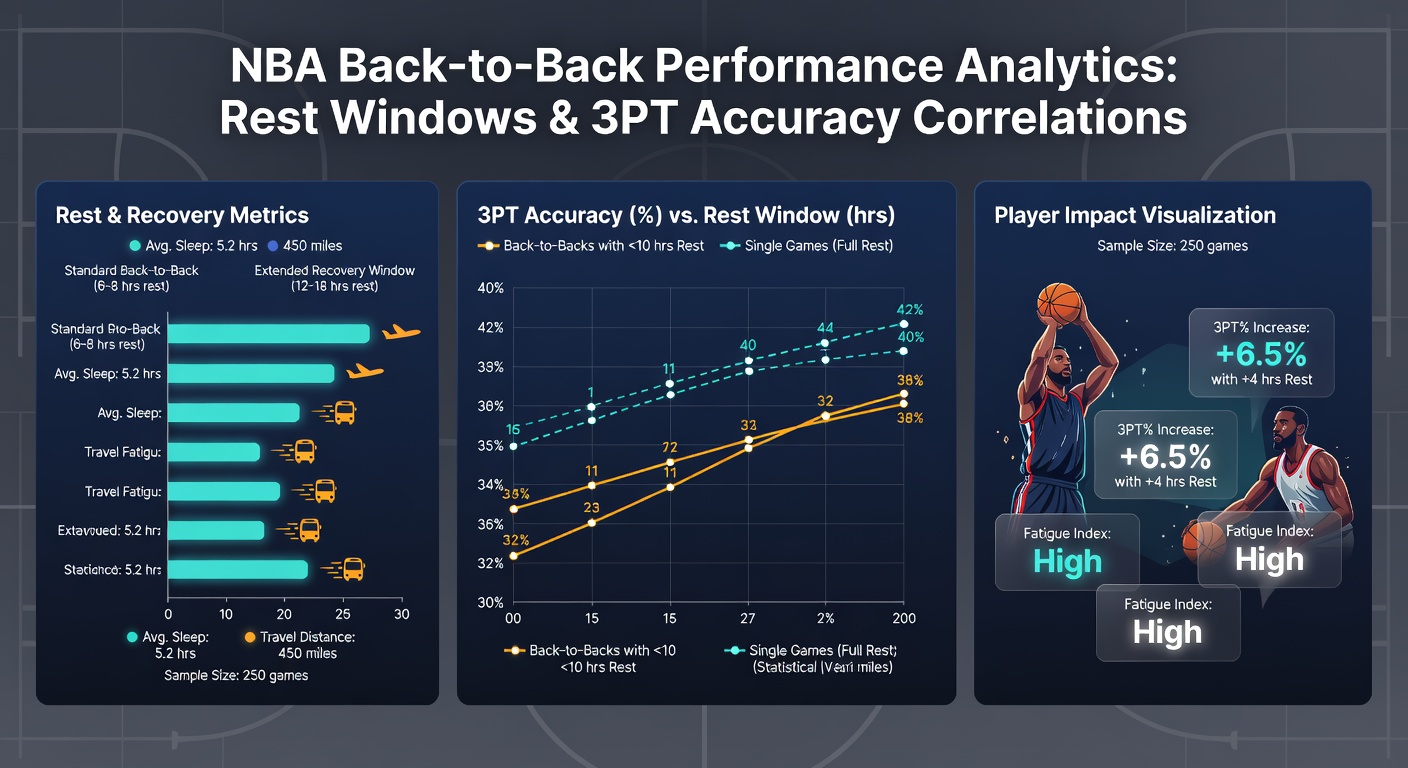
The league constructs its calendar with clusters of games that force many clubs into back-to-backs, and those sequences appear most frequently during the early winter months when the regular season reaches peak density. Observers note that Eastern Conference teams sometimes face additional strain from cross-country flights that cut into sleep cycles while Western clubs deal with altitude changes after short turnarounds. Researchers at sports science centers have examined these fixtures and found that the average rest window between back-to-backs hovers around 20 hours for road teams, whereas home squads occasionally receive slightly longer buffers when arena availability permits.
Recovery Windows and Their Measured Effects
Recovery windows break down into categories that include overnight rest after evening games, travel recovery on the same day, and full days off that allow medical staff to implement targeted protocols. Studies compiled by performance labs indicate that three-point attempts taken after shorter windows show reduced conversion rates because fatigue affects release consistency and decision-making speed at the perimeter. One dataset covering multiple seasons revealed that players logging over 30 minutes in the first game of a back-to-back posted three-point percentages nearly four points lower in the second contest, and those declines sharpened further when the second game involved significant travel.
Player Position and Shot Volume Influences
Guards and wings who handle high three-point volumes tend to exhibit clearer drops in accuracy after abbreviated rest, while big men who attempt fewer perimeter shots display more stable numbers regardless of recovery length. League tracking systems record that catch-and-shoot specialists maintain slightly better percentages than off-the-dribble shooters during back-to-backs, although both groups register measurable declines when rest falls below 18 hours. Teams that rotate their bench more aggressively during the opening game of such pairs often preserve shooting efficiency for the follow-up contest, according to figures released by the NBA's player tracking partners.
Three-Point Accuracy Trends Across Multiple Seasons
Season-long aggregates demonstrate that overall three-point shooting in back-to-back games sits roughly two to three percentage points below non-back-to-back contests, with the gap widening in the final month of the regular season when cumulative fatigue builds. Data indicates that home teams shooting after a back-to-back still outperform road teams in the same situation, yet both groups post lower numbers than their season averages. Analysts reviewing games played through early 2026 have observed that clubs employing advanced recovery technologies, such as cryotherapy and sleep monitoring, sometimes narrow those gaps, although the improvements remain inconsistent across different rosters.
What's interesting emerges when researchers isolate specific rest intervals: teams receiving 36 or more hours between games maintain three-point accuracy closer to their established baselines, while those limited to under 20 hours experience sharper reductions that compound if the sequence extends to three games in four nights. External studies from university kinesiology departments in North America and Australia have corroborated these patterns through controlled comparisons of shot mechanics before and after varying recovery periods.
Travel and Venue Factors in the Equation
Travel distance adds another layer because cross-country flights compress available recovery time and disrupt circadian rhythms that influence shooting rhythm. Teams returning from Western trips to Eastern time zones frequently show elevated three-point misses in the immediate follow-up game, whereas shorter regional trips produce milder effects. Venue differences also appear in the numbers, with domed arenas sometimes linked to slightly higher accuracy regardless of rest windows, although researchers attribute most variance to player workload rather than building conditions alone.
Case Examples from Recent Schedules
One Eastern Conference club that navigated a January stretch with four back-to-backs in three weeks recorded a collective three-point percentage nearly five points below its season mark during those second games, and the drop reversed once the schedule eased. Another Western team that prioritized load management for its primary perimeter scorers preserved accuracy levels even after short turnarounds, illustrating how rotation decisions interact with recovery windows. These examples align with broader league data that continues to be updated as the 2025-2026 campaign moves toward its June conclusion.
Statistical Correlations and Predictive Models
Statistical models built from play-by-play and biometric data reveal moderate negative correlations between rest hours and three-point percentage changes, with correlation coefficients typically ranging between -0.25 and -0.40 depending on the sample size and variables included. Predictive frameworks that incorporate travel, minutes played, and prior game shooting volume achieve higher accuracy when forecasting second-game outcomes, yet they still leave substantial unexplained variance because individual player responses differ widely. Organizations that integrate these models into preparation routines report incremental improvements in identifying lineups likely to sustain perimeter efficiency after abbreviated rest.
Conclusion
Rest recovery windows shape three-point accuracy patterns across NBA back-to-backs in measurable ways, with shorter intervals consistently tied to reduced conversion rates that vary by position, travel, and workload management. Data compiled through multiple seasons and updated into 2026 provides teams and analysts with clearer benchmarks for anticipating performance shifts, while ongoing research continues to refine understanding of how recovery protocols interact with the demands of consecutive games. These correlations remain central to schedule analysis and player deployment strategies throughout the league.