Examining Referee Bias Indicators Through Historical Penalty Award Distributions in Top European Soccer Leagues
Ellis Wolf · Aug 14, 2026
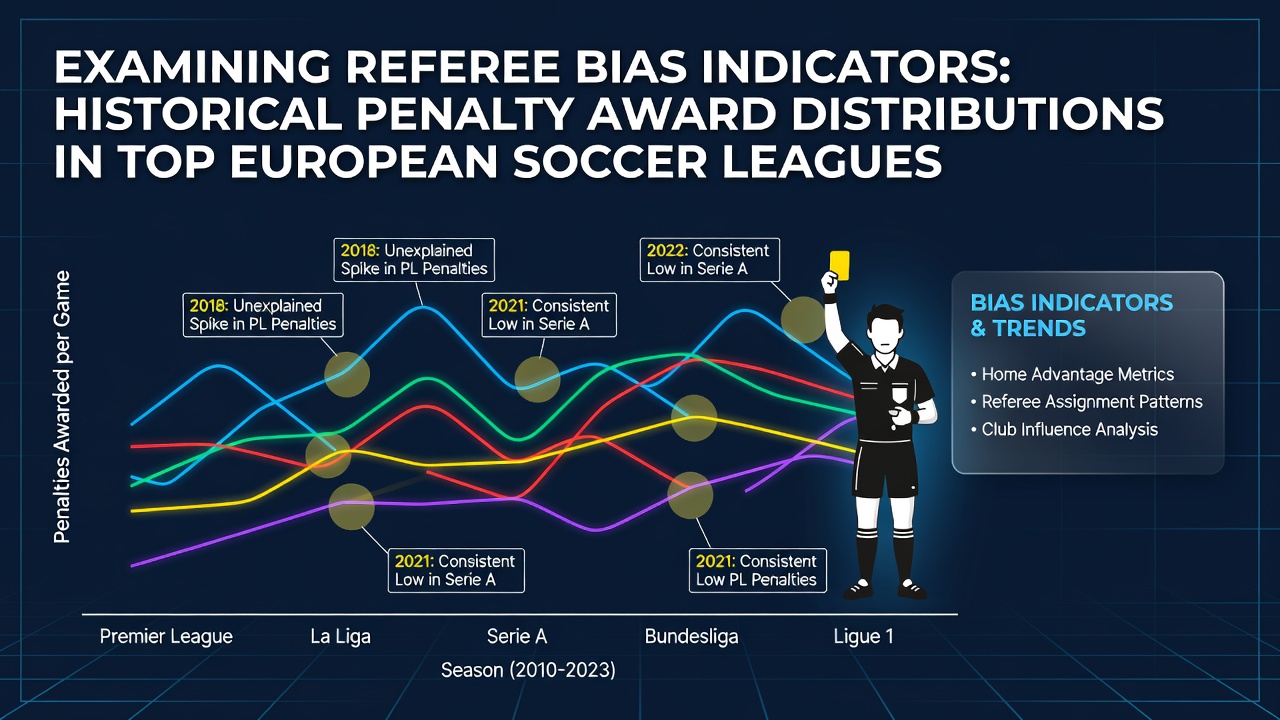
Examining Referee Bias Indicators Through Historical Penalty Award Distributions in Top European Soccer Leagues
Penalty decisions in top European soccer leagues have long served as measurable indicators for researchers tracking potential referee patterns, with historical distributions revealing consistent variations across the Premier League, La Liga, Serie A, and Bundesliga. Data collected over multiple seasons shows home teams receiving penalties at rates that exceed away teams by notable margins, while specific referee assignments correlate with shifts in those frequencies. Observers note these patterns through league archives and official match reports, where analysts compile figures from thousands of games spanning the past two decades. As of August 2026, updates from the completed 2025-26 campaign continue to feed into ongoing reviews that compare current distributions against earlier benchmarks.
League-Wide Penalty Trends and Data Patterns
Records from the four major leagues indicate that home sides account for roughly 58 to 64 percent of all penalties awarded each season, a split that holds steady across different competitions even as overall penalty numbers fluctuate. Bundesliga matches, for instance, average 0.28 penalties per game while Serie A sits closer to 0.35, yet the home-away ratio remains comparable in both. Researchers at academic institutions have examined these figures through regression models that control for factors such as shot volume inside the box and foul locations, and the models still leave residual differences tied to venue. One study published in a European sports science journal tracked over 12,000 matches and found referee experience levels influenced how often certain calls went to the attacking side.
Referee-Specific Distributions Across Seasons
Individual officials display distinct penalty profiles when their match histories are aggregated, with some awarding 15 to 20 percent more penalties to home teams than their peers over equivalent game samples. These differences persist after adjustments for team strength and match importance, prompting statisticians to flag certain names for closer monitoring during fixture planning. In La Liga, distributions tied to long-serving referees show tighter clustering around expected values, whereas newer officials sometimes produce wider spreads in early career seasons before stabilizing. Cross-league comparisons further highlight that Bundesliga referees tend toward lower overall penalty counts per match than their Serie A counterparts, yet the directional bias toward home decisions appears in both sets of records.
Statistical Methods Used to Identify Indicators
Analysts apply Poisson distributions and logistic regressions to historical datasets, testing whether observed penalty counts deviate significantly from expected values derived from possession and attacking metrics. When residuals exceed thresholds established through bootstrap resampling, those matches receive additional review for contextual variables such as crowd size and time of day. European sports governing bodies have supported similar frameworks in technical reports that emphasize transparency in decision-making data. A Canadian research group at the University of Ottawa published findings that linked higher crowd densities to increased home penalty rates, with effect sizes varying by league culture and stadium design. These methods allow observers to separate random variation from systematic patterns without relying on subjective interpretations of individual incidents.
Case Examples from Recent Campaigns
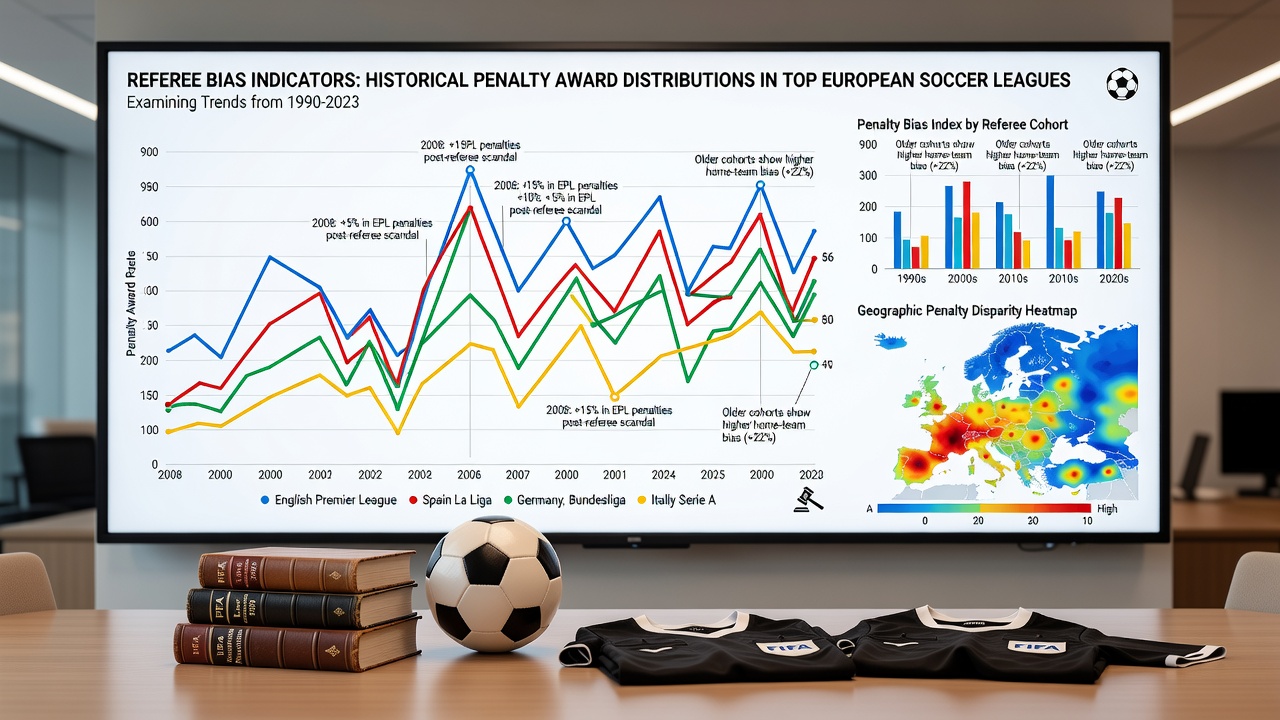
Take one referee who officiated 28 matches in the 2024-25 Premier League season and awarded 11 penalties, nine of which went to home teams despite those sides holding only 53 percent of total shots on target. A separate official in the same league recorded a more balanced split across 26 games, issuing seven penalties with four favoring visitors. Such examples illustrate how distributions can diverge even when match difficulty metrics remain similar. In Serie A during the same period, data showed three referees consistently exceeding league averages for home awards while maintaining low overall foul counts, patterns that repeated across multiple venues. Observers tracking these cases note that the differences become more pronounced in high-stakes fixtures where pressure on decisions intensifies.
External Factors Influencing Award Rates
Weather conditions, fixture congestion, and international breaks appear in some models as secondary variables that interact with referee tendencies. Matches played under floodlights show slightly elevated penalty frequencies in certain leagues, though the home advantage ratio stays largely unchanged. Researchers have also examined how squad rotation during midweek European ties affects defensive positioning and subsequent penalty incidents in domestic games. Figures compiled across the top divisions indicate that teams returning from international duty concede penalties at marginally higher rates in the following weekend round, an effect documented in match logs from both the Bundesliga and La Liga. These interactions add layers to the analysis but do not erase the core venue-based disparities observed over longer time spans.
Conclusion
Historical penalty distributions across Europe's elite leagues provide quantifiable material for examining referee decision patterns, with home-away splits and official-specific profiles forming the primary indicators. Continued data collection through the 2025-26 season and beyond supplies fresh inputs for statistical models that refine earlier conclusions. Governing organizations and independent research teams maintain archives that support ongoing scrutiny, ensuring distributions remain available for comparative study across future campaigns.