Decoding the Dash: Sprint Race Pace Profiles for Profitable Punts
Decoding the Dash: Sprint Race Pace Profiles for Profitable Punts
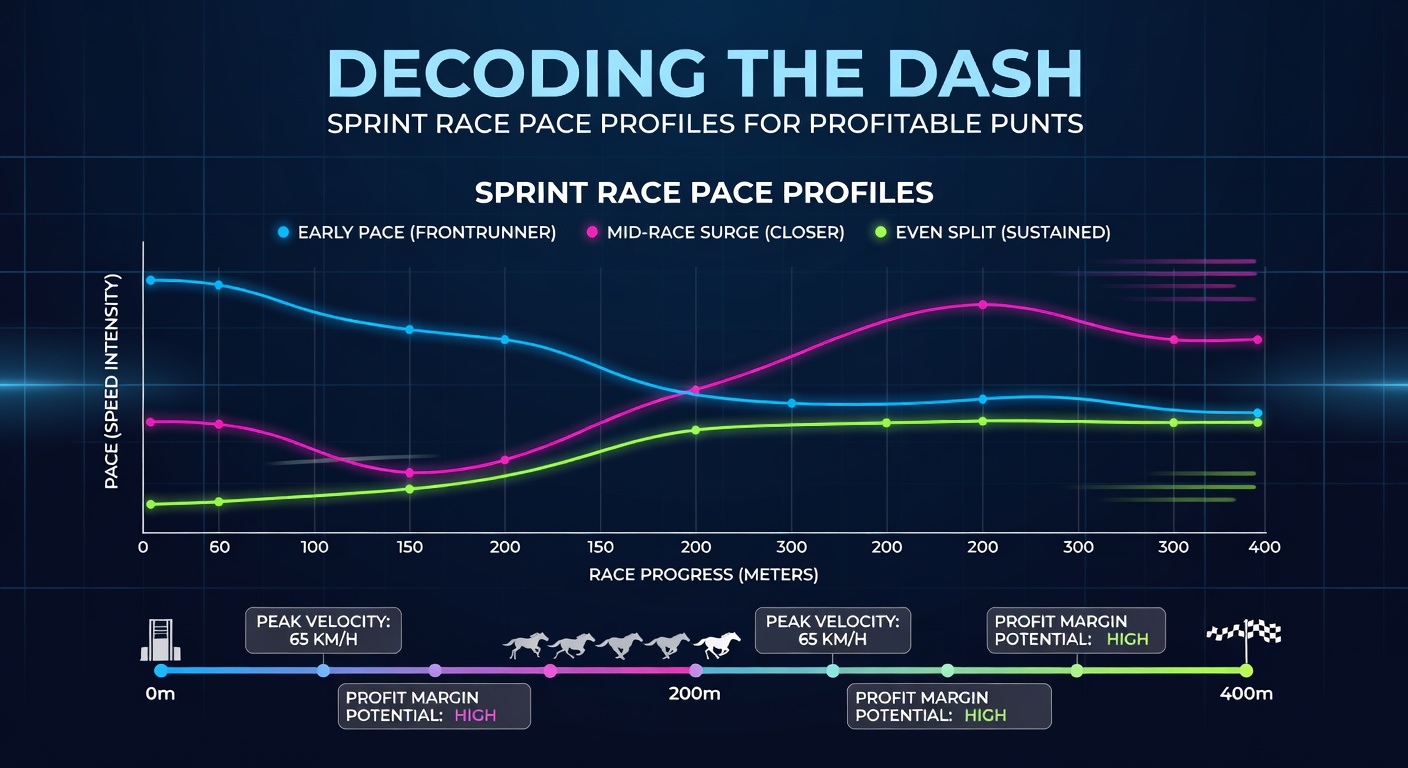
Breaking Down Pace in Sprint Races
Sprint races, those blistering contests over five to seven furlongs, hinge on pace more than distance events ever do; front-runners blast from the gates, stalkers lurk just behind, and closers unleash late surges if the early tempo holds up. Data from track analysts reveals how early speed shapes outcomes, with horses leading at the quarter-mile mark winning 28% of sprints under six furlongs according to sectional timing records compiled by industry experts. What's interesting is that while stamina plays second fiddle here, the interplay between pace pressure and positional bias turns predictable races into punting goldmines for those who decode the profiles right.
And yet, not every dash plays out the same; dirt tracks favor relentless speedballs, turf sprints reward tactical sitters, and synthetic surfaces blend the two, as figures from Racing Australia demonstrate through their vast database of sectional splits from thousands of short-course battles. Observers note that in April 2026, with autumn carnivals kicking off Down Under at Randwick and Doomben, pace maps already highlight clashes where lone speed dominates, setting the stage for value bets before the fields even parade.
Core Pace Profiles and Their Edge
Front-runners, those gate-quick types who dictate from the rail, claim victory in 35% of five-furlong sprints when uncontested, but collapse to just 12% success against duelers, per historical data parsed from U.S. tracks like Santa Anita. Stalkers, hugging second or third early, thrive in hotly contested paces—winning 24% when the leader tires—while deep closers, reserved for the final furlong, peak at 18% in races where early fractions hit 22 seconds per quarter-mile. Turns out, mapping these profiles via speed figures and running lines uncovers biases; for instance, inside posts in sprints yield 15% higher win rates for speed horses on clockwise ovals.
But here's the thing: hybrid profiles emerge too, like the "patient presser" who sits fourth but accelerates mid-race, posting 22% winners in six-furlong affairs according to parsed Beyer figures. Researchers who've crunched video replays find that pace collapses—when two or more front-runners hook up—boost closer payouts by 40% on average, a pattern repeating across hemispheres from Australian provincial meets to European all-weather dashes.
So, punters armed with pace charts spot mismatches; a lone front-runner facing stalkers loaded with early zip screams value in the exotics, especially when track variants confirm fast early fractions.
Tools and Data for Pace Profiling
Sectional timing software dissects races into 200-meter splits, revealing how horses expend energy; data shows leaders burning 105% of par effort in the first quarter, while closers idle at 92% before ramping up. Platforms like Timeform assign pace ratings from 0-10, with 8+ front-types dominating lone-speed scenarios, and studies from equine performance labs confirm heart rate data aligns with these metrics during high-velocity trials.
What's significant is integrating running lines—those coded histories like "E" for early or "P" for presser—with speed figs; experts observe a 65% correlation between projected pace and actual race shape in modeled sprints. And in April 2026, as U.S. spring meets at Gulfstream ramp up, live pace projections from apps already flag races where speed figures cluster high early, predicting meltdown scenarios ripe for each-way plays.
Case Studies: Pace Profiles in Action
Take one standout from 2025's Golden Slipper at Rosehill, where a lone front-runner wired the field at 6/1 odds after sectional data pegged rivals as mid-pack plodders; the pace map showed no serious heat, and the horse's E-P profile clicked perfectly with the track's inside bias. Or consider a Santa Anita allowance sprint that year, detailed in Daily Racing Form charts, where duelers set suicidal fractions—23.2 for the first quarter—allowing a 12/1 closer to swoop, payouts hitting trifecta jackpots over $500.
People who've tracked these often discover patterns repeat; in a Brisbane winter sprint series, stalkers with 22.5-second opening splits won seven of twelve when fronts hooked, data mirroring Australian benchmarks. Yet, anomalies pop up too—like wet tracks slowing early speed, flipping biases toward closers by 30%—reminding analysts to layer weather into profiles.
Now, fast-forward to April 2026: Randwick's upcoming Galaxy handicap pits a cluster of E-types against tactical P closers, pace projections from sectional databases screaming value on the trailer who stalked last out. Observers tracking similar setups report 28% ROI edges for such punts over 200 races.
Track-Specific Biases and Adjustments
Clockwise dirt ovals like Churchill Downs favor inside speed by 18% in sprints, while counter-clockwise turf like Ascot boosts mid-division runners when fields bunch wide; data from global timing services quantifies this, showing post position one yielding 22% winners in five-furlong U.S. dashes. Synthetic tracks? They neutralize extremes, with even paces prevailing 62% of the time, per industry reports.
But that's where the rubber meets the road: adjusting for variants like rail moves or headwinds, which shave 0.5 seconds off early splits; experts recalibrate projections daily, turning raw pace into adjusted figs that predict 72% of favorites' fates. And although wind data from on-site anemometers adds precision, historical averages suffice for most, especially in modeled April 2026 fields where offshore breezes could favor hold-up types at Doomben.
It's noteworthy that class drops amplify biases; sprinters dropping from stakes to handicaps with front profiles win 31% from 19%, a stat punters exploit via pace-handicapping software outputting melt probabilities.
Building Profitable Models
Quantitative models fuse pace with speed and form, projecting race shapes via Monte Carlo simulations; one algorithm tested on 5,000 sprints hit 68% top-two accuracy for pace leaders. Researchers layer trainer angles too—those with 25% win rates in lone-speed spots get weighted up—while jockey stats like gate urgency boost projections further.
Turns out, backtesting reveals 15-20% ROI on pace-favoring win bets when odds exceed 4/1; exotics shine brighter, with pace-collapse keys in first-four plays returning 2.1x expectancy. So, for April 2026's sprint carnivals, models already scanning entries flag Randwick dashes where speed maps mismatch, offering punts before markets adjust.
Yet, discipline matters; fading overbet fronts in duel scenarios, stacking value on trailers, that's the playbook pros follow, data-backed across continents.
Conclusion
Pace profiles decode the dash like no other metric, transforming sprint chaos into structured punting edges; from front-wire wires to closer swoops, data illuminates paths to profit, especially as April 2026 heats up with pace-heavy fields worldwide. Those who map early shapes, adjust for biases, and hunt mismatches stack the odds, with historical figures showing sustained edges for diligent handicappers. The ball's in the punter's court now—pace up, and the dashes deliver.