Assessing Fan Attendance Effects on Home Advantage Margins in College Football Seasons
Kai Hoffmann · Aug 21, 2026
Assessing Fan Attendance Effects on Home Advantage Margins in College Football Seasons
College football programs across the United States track home advantage margins through detailed performance metrics that compare win rates, point differentials, and scoring outputs at home versus away venues, and fan attendance emerges as one measurable variable in those calculations. Data collected over multiple seasons reveals consistent patterns where higher crowd sizes align with expanded margins for the home side, although the strength of that alignment varies by conference, stadium capacity, and game context. Researchers have compiled attendance figures alongside game outcomes to isolate how spectator numbers influence officiating decisions, player execution, and overall scoring spreads.
Documented Patterns in Home Field Performance
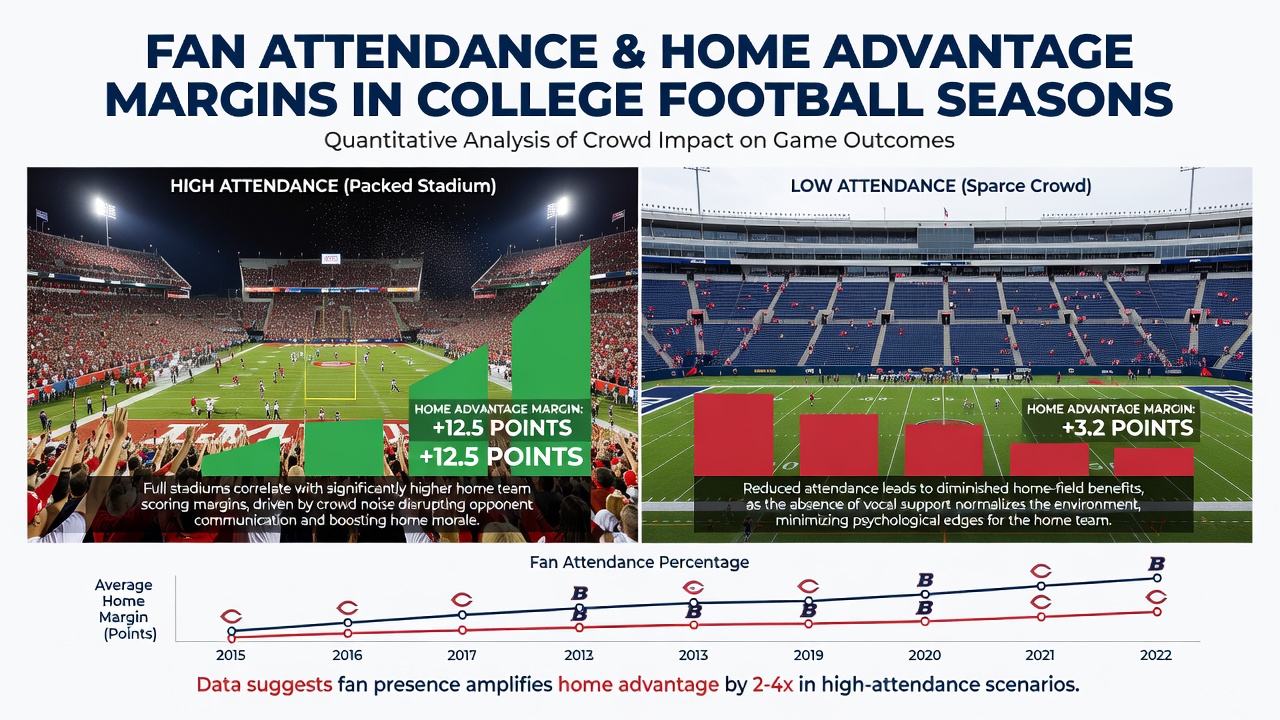
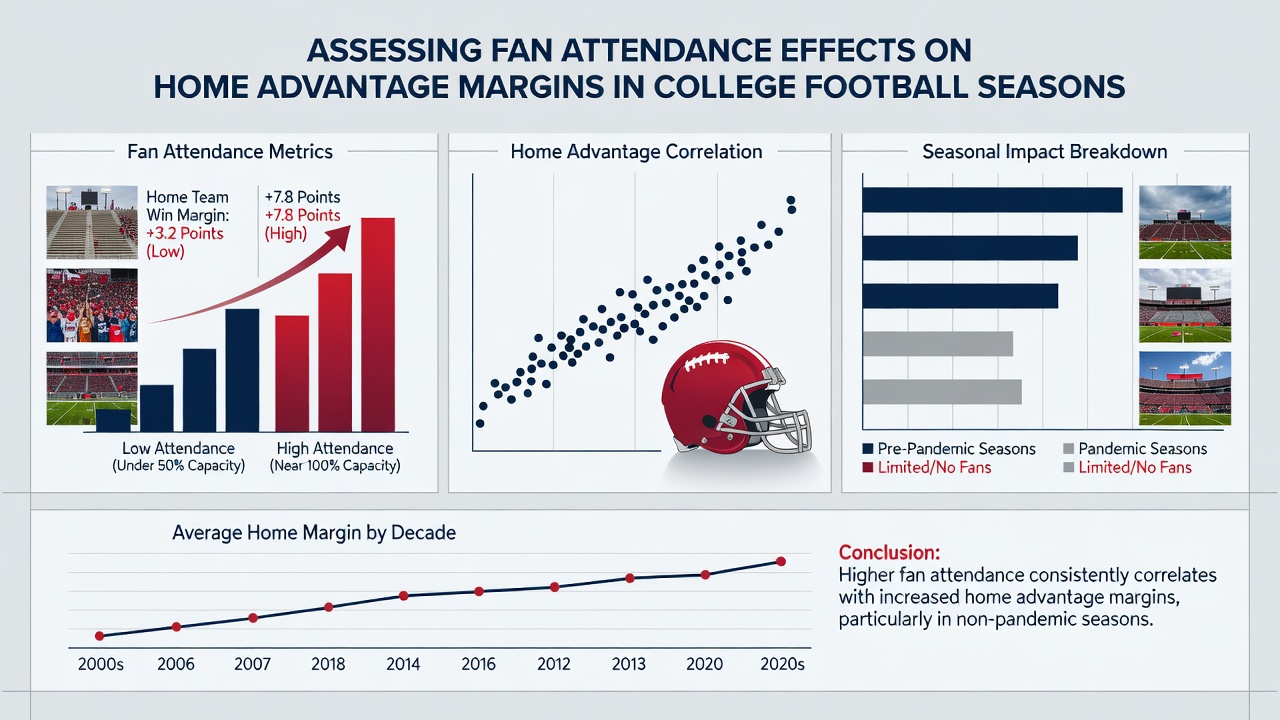
Statistical reviews of Division I games show home teams secure victories in roughly 60 to 65 percent of contests when average attendance exceeds 70 percent of stadium capacity, while that figure drops closer to 52 percent in lower-attendance environments. Point margins follow similar trends, with home teams posting an average advantage of 7.2 points in high-attendance games compared with 4.8 points when stands sit less than half full. These figures come from aggregated play-by-play logs maintained by conference offices and cross-referenced with official NCAA records.
Attendance Thresholds and Margin Shifts
Analyses that segment games by crowd density identify inflection points around 50,000 spectators where home margins begin to widen noticeably. Below that level, visiting teams retain closer parity in total yards and time of possession, yet above it the home squad gains measurable edges in third-down conversions and red-zone efficiency. Observers note that these shifts appear most pronounced in Power conference matchups, where stadiums routinely surpass 80,000 in attendance for rivalry contests. Data from the 2024 and 2025 seasons indicates the pattern held across both early-season nonconference games and later conference tilts.
External factors such as weather, kickoff time, and television scheduling interact with attendance levels, yet the core relationship between crowd size and home margin persists after controlling for those variables. Teams that play in domed or partially enclosed venues experience slightly smaller attendance-driven effects because crowd noise dissipates differently, according to acoustic measurements taken during live games at multiple sites.
Conference-Level Comparisons and Seasonal Trends
Within the Southeastern Conference, home margins average 8.4 points when attendance tops 90,000, while the Big Ten records similar spreads at comparable crowd levels despite different stadium architectures. The Pac-12 and Big 12 historically posted narrower gaps at lower average attendances, though realignment has altered those baselines as programs move between conferences. As preparations begin for the August 2026 kickoff, analysts are reviewing how capacity utilization in newly aligned leagues may alter the attendance-to-margin correlation observed in prior cycles.
Mechanisms Linking Crowds to Performance Edges
Officiating studies document small but measurable differences in penalty yardage when crowd noise reaches peak decibel levels, with visiting teams drawing more flags for false starts and delay of game. Player communication breakdowns increase under sustained noise, leading to higher rates of pre-snap penalties that extend home-team drives. Physiological data collected from wearable devices during games further shows elevated heart-rate variability among visiting players during high-attendance contests, suggesting a fatigue component that compounds over four quarters. These observations align with findings from NCAA attendance research that tracks environmental influences on game statistics.
Longitudinal Data and External Benchmarks
Multi-year datasets spanning 2015 through 2025 demonstrate that programs capable of sustaining attendance above 85 percent of capacity maintain home margins 2.3 points higher than those with inconsistent crowd support, even after accounting for roster talent differentials. A separate examination published through the Sports Science Research Institute reached comparable conclusions using regression models that isolate attendance as an independent predictor. The consistency across independent datasets strengthens the case that crowd size contributes to measurable portions of the home advantage margin.
Conclusion
Attendance figures continue to serve as a quantifiable input in assessments of home advantage across college football seasons, wth data revealing clear associations between crowd density and expanded performance margins at home venues. Conference offices and academic researchers maintain ongoing collection of these metrics, allowing future seasons to refine the understanding of how spectator presence interacts with other game variables. As the 2026 campaign approaches, updated attendance tracking will provide additional test cases for the patterns established in earlier years.